Experiments
Learn to systematically test and compare your LLM applications
Experiments help you systematically compare different prompts, evaluate their effectiveness, and track performance over time. They are the foundation of data-driven LLM development, allowing you to test multiple variations and analyze which performs best for your specific use case.
What is an Experiment?
An experiment combines several key components to create a systematic evaluation:
- Collection - A set of test inputs (template variables) representing different scenarios
- Prompt Template - The foundation containing your prompt with
{{variables}} - LLM Config - The model configuration (provider, parameters, etc.)
- Criterion Set - Evaluation criteria defining what makes a good response
When you run an experiment, elluminate generates responses for each input in your collection, then automatically evaluates each response against your criteria.
Which of these components you configure depends on the experiment type you pick. A standard Generate & Evaluate run uses all four, while Evaluate Imported Responses skips the prompt template and model entirely and scores responses you already have. See Choose an experiment type for the full list.
Creating Your First Experiment
Step 1: Navigate to Experiments
In your project, go to the Experiments page. You'll see your experiment runs list with options to create new experiments or view the timeline.
Step 2: Choose an experiment type
Click "New Experiment". elluminate first asks which kind of experiment you want to create. The setup that follows is type-aware — it reveals only the steps relevant to the type you pick.
| Experiment type | What it does | Setup steps |
|---|---|---|
| Generate & Evaluate | Run a prompt template through an LLM against your collection. Variables are filled in for each row, the model is called, and responses are evaluated against your criteria. | Collection → Prompt template → Model → Criteria |
| Evaluate Imported Responses | Evaluate externally generated responses already stored in your collection. Your criteria run directly against them — no LLM inference. | Collection → Response column → Criteria |
| Persona | Simulate multi-turn conversations between LLM-driven personas and your chatbot. Every persona in the group runs against every row of the question library, and each resulting dialogue is evaluated. | Persona group → Question library → Prompt template → Model → Criteria |
| Agentic | Evaluate an agent's full trajectory across the tasks in your collection, including its tool calls, reasoning steps, and final output. | Collection → Prompt template → Model → Criteria |
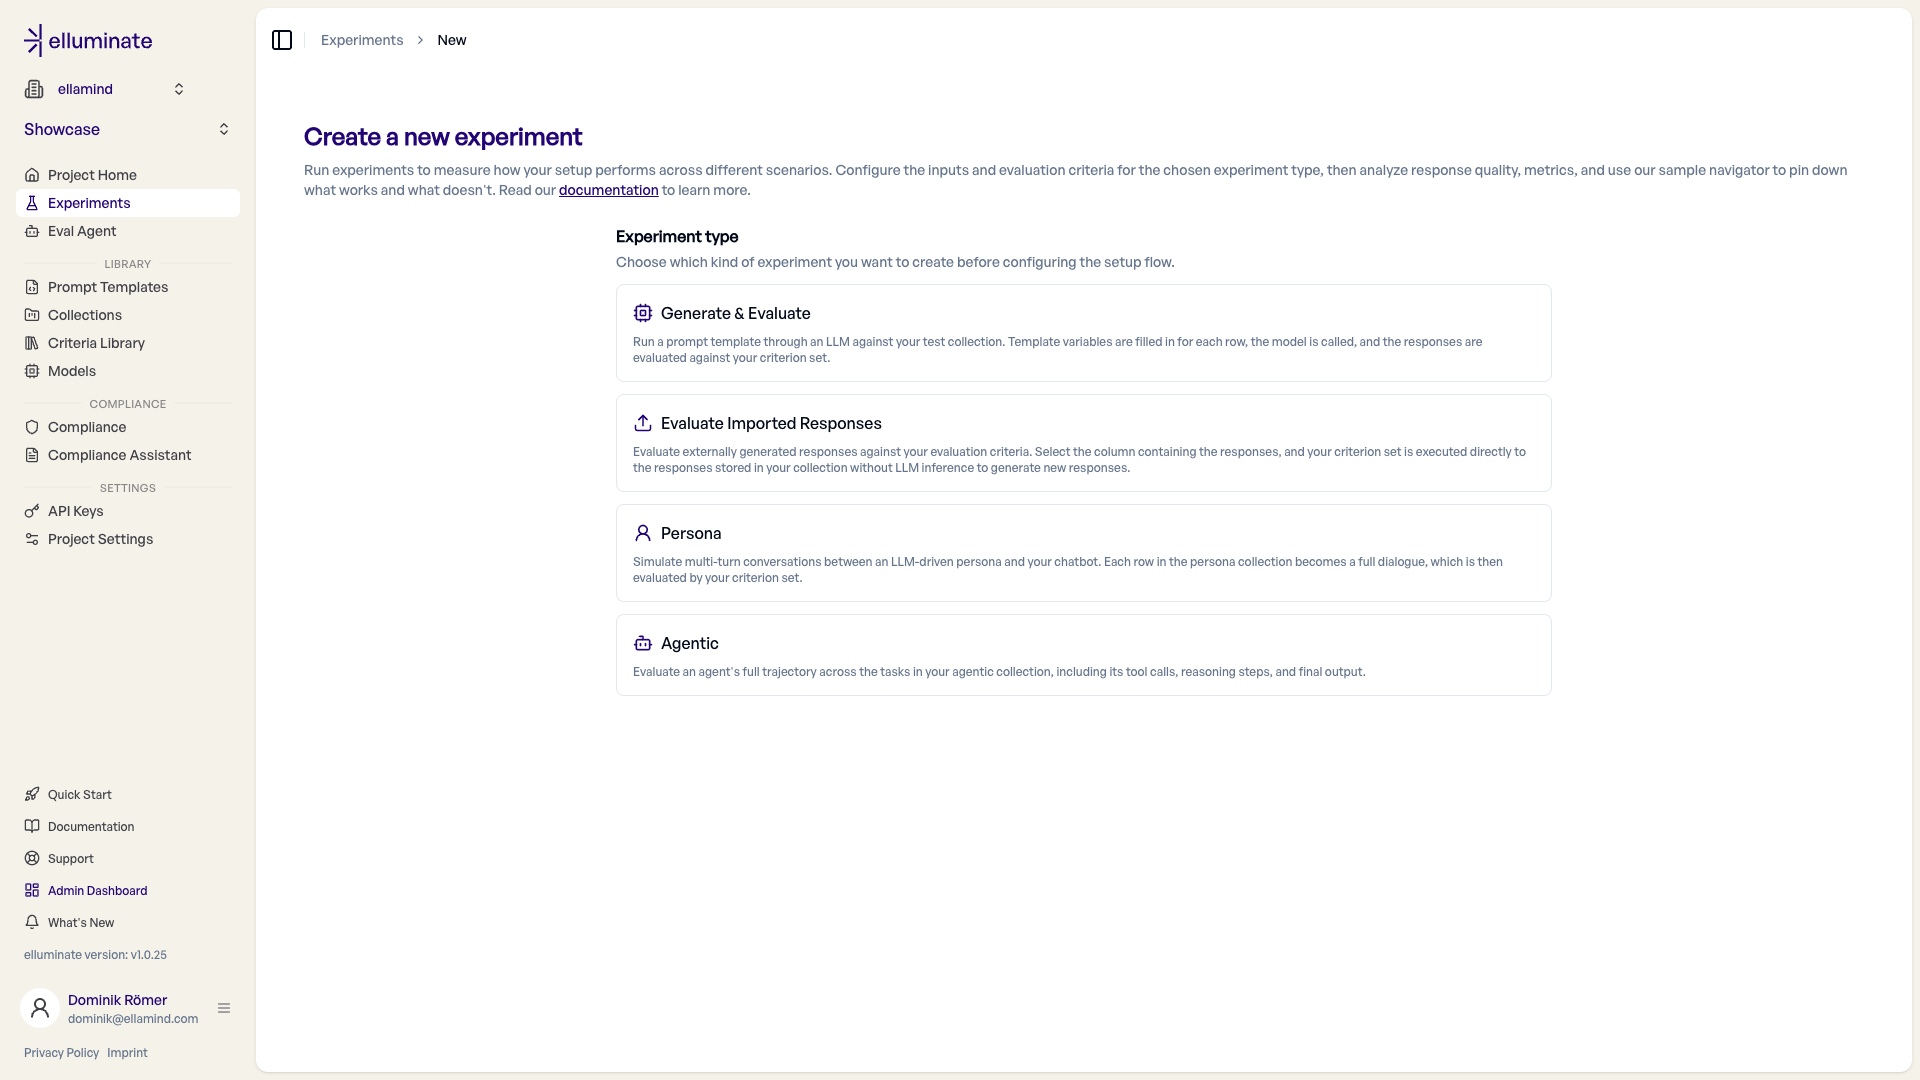
After picking a type it collapses to a summary row; use "Change type" to switch at any point.
Type-specific collections
Persona and Agentic experiments require a matching collection type (Persona or Agentic), while Generate & Evaluate and Evaluate Imported Responses use standard collections. The Agentic type is only available in non-production environments while the workflow is being finalized.
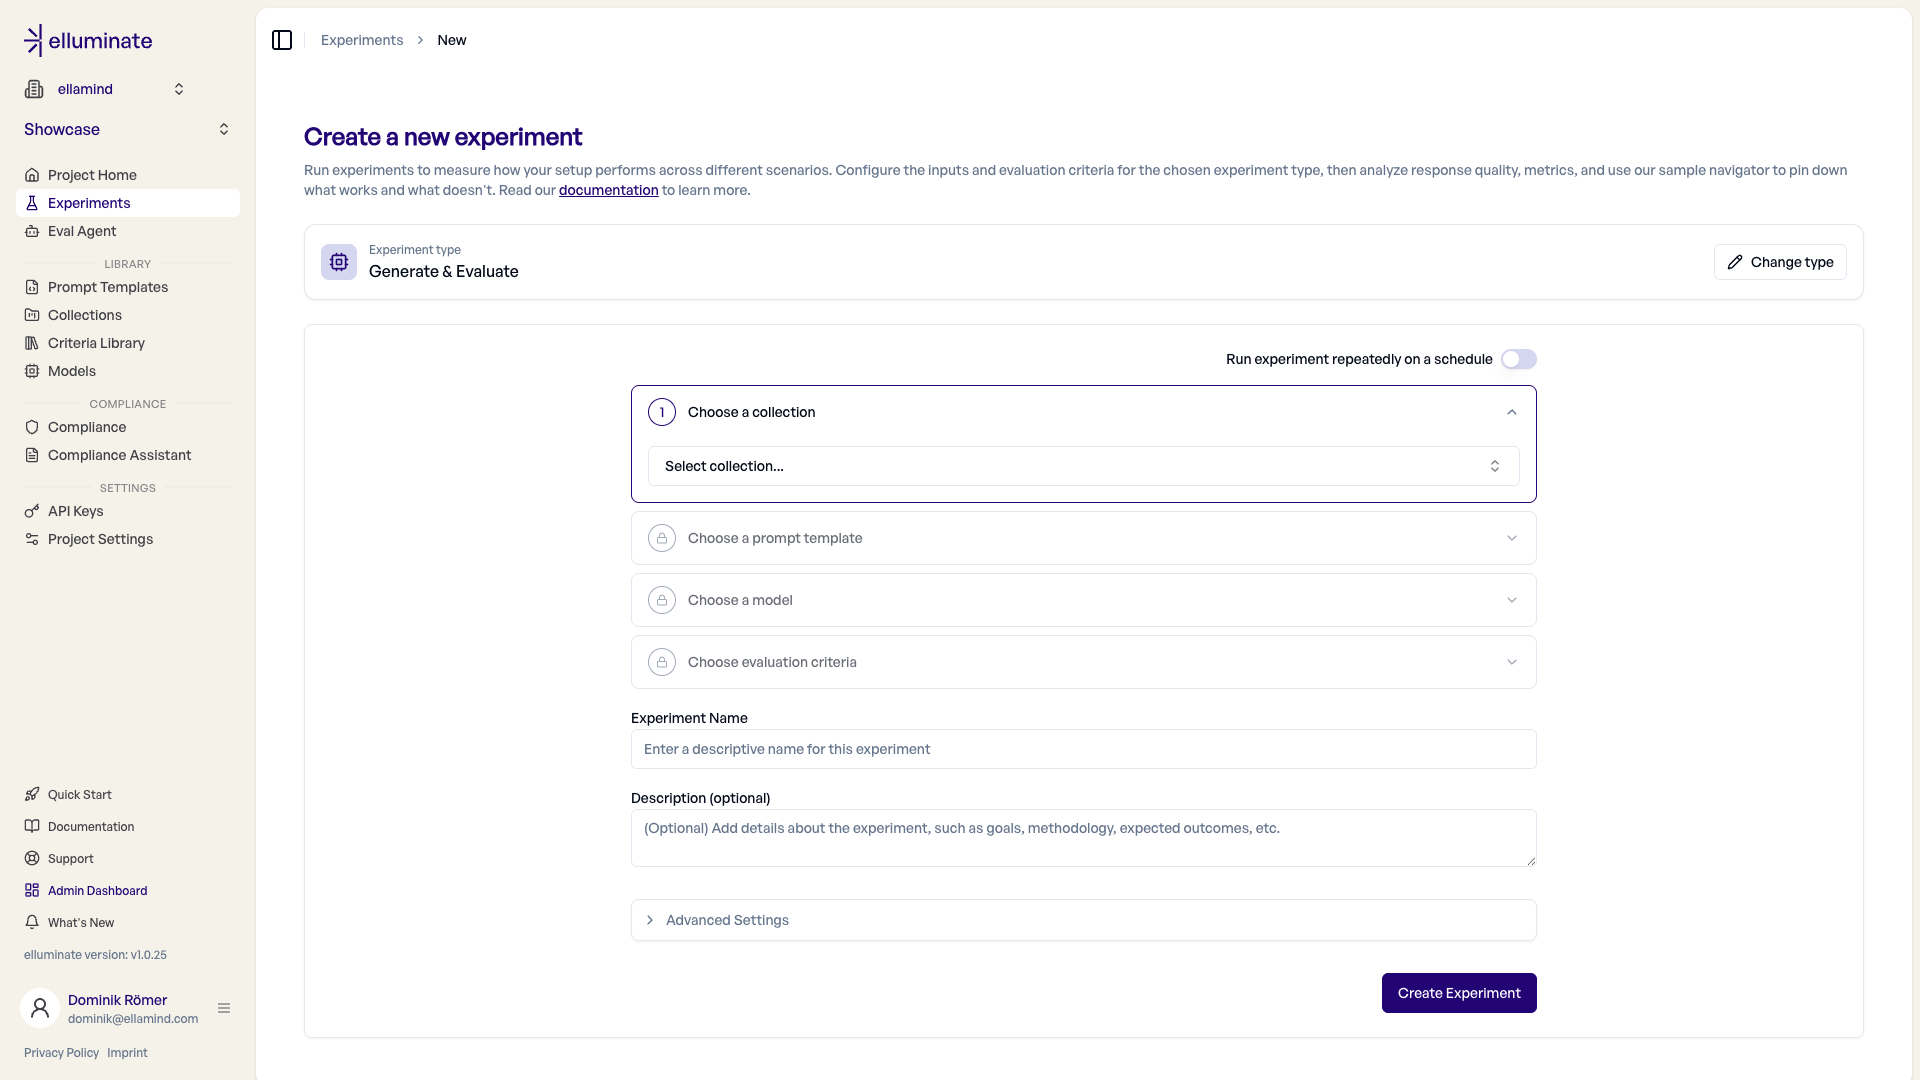
Step 3: Configure the setup flow
elluminate guides you through a step accordion — one step at a time, each unlocking the next. Completed steps collapse to a summary you can reopen to change a selection. For a Generate & Evaluate experiment the steps are:
- Choose a collection - Your test inputs dataset.
- Choose a prompt template - The versioned template with
{{variables}}. Optional when the collection already contains full prompts (a Conversation or Raw Input column). - Choose a model - The LLM config used to generate responses.
- Choose evaluation criteria - The criterion set responses are evaluated against.
Below the accordion you set the Experiment Name and an optional Description.
Compatibility rules
The system will only offer mutually compatible Collections, Prompt Templates and Criterion Sets. If your desired selection does not appear, check for issues on your placeholders and column naming.
Advanced Settings
- Rating Mode - Detailed mode includes reasoning for each criterion and is recommended for better interpretability. Fast mode provides only ratings without explanations and may be slightly faster.
- Epochs - Epochs allow you to run the same evaluation multiple times. This makes the statistics more reliable but can take some time.
- Rating Version - Select the rating model version to use for evaluating responses. Defaults to the version set in your project settings.
Step 4: Run the Experiment
After clicking "Create Experiment", elluminate will:
- Generate Responses - Create LLM responses for each test input (skipped for Evaluate Imported Responses, which uses the responses already in your collection)
- Rate Responses - Evaluate each response against your criteria
- Calculate Results - Compute overall scores and criterion performance
You can monitor progress in real-time from the experiment detail page.
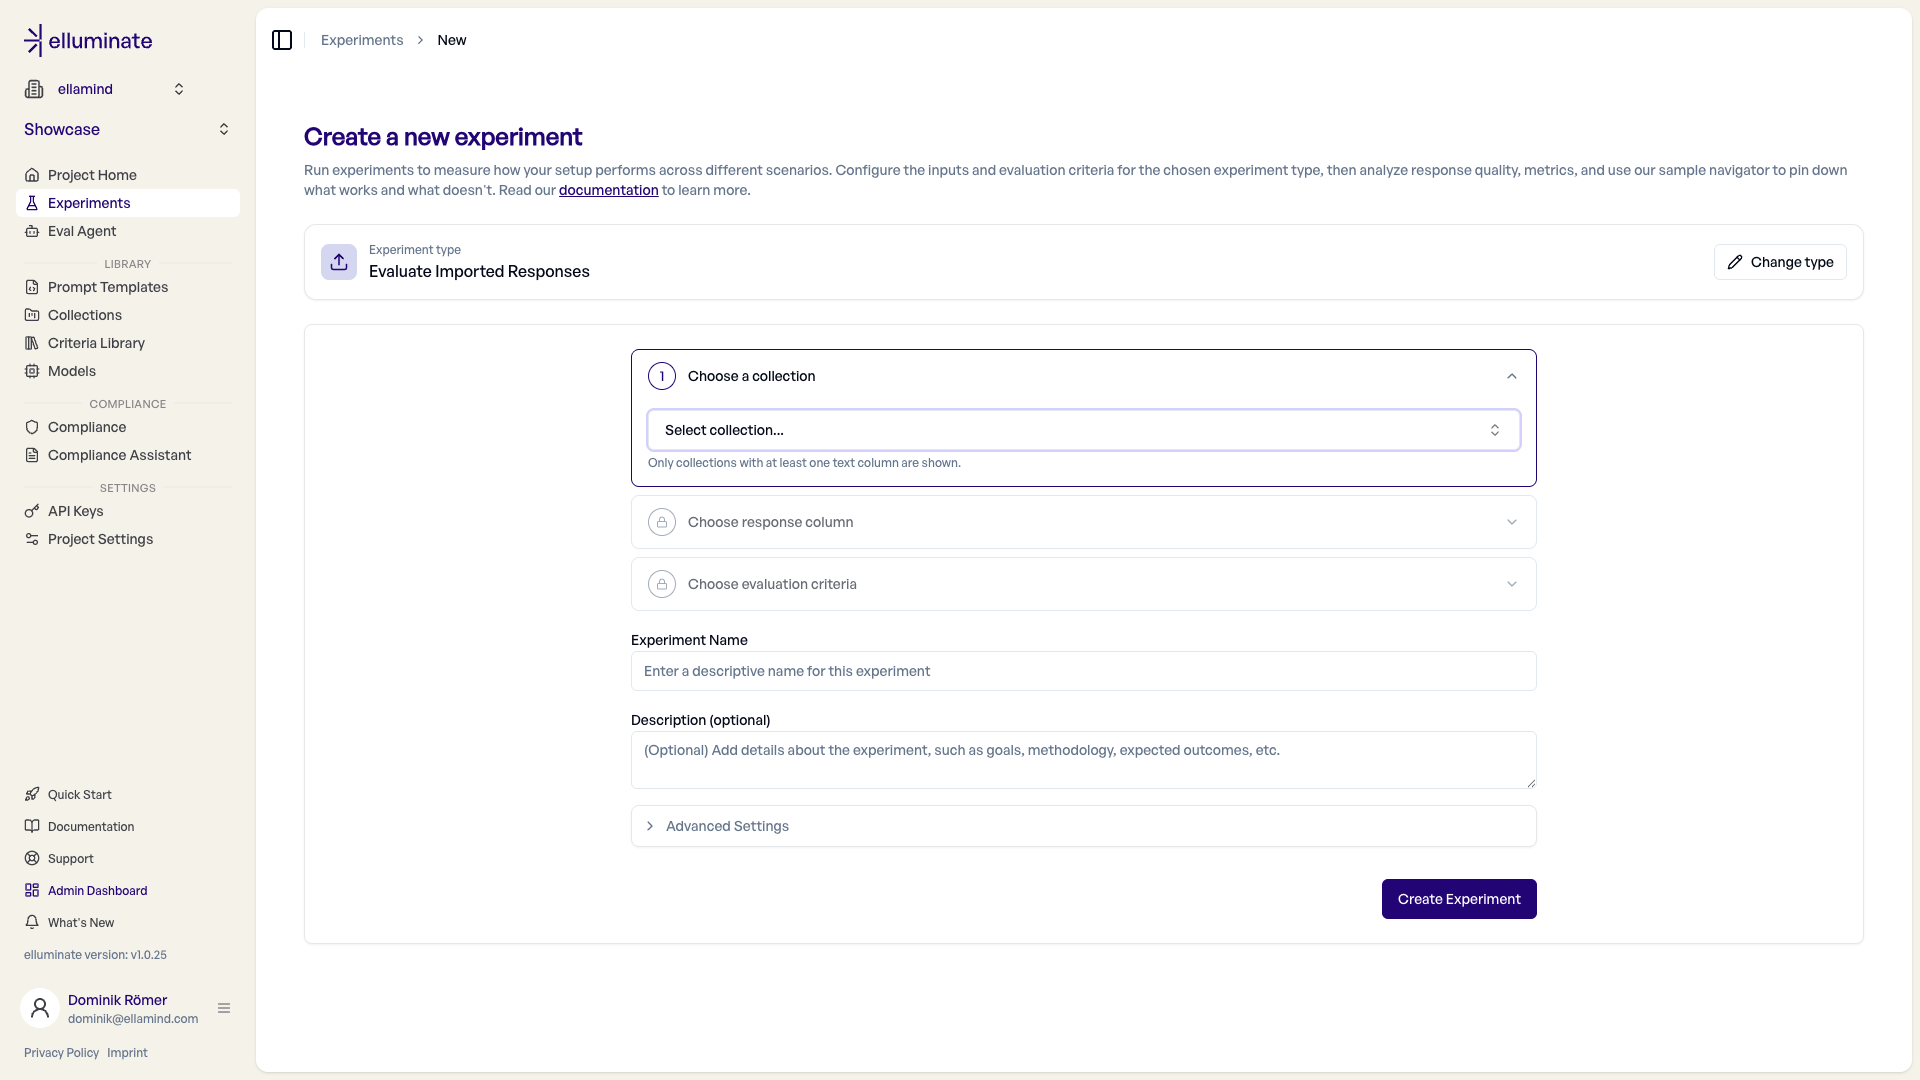
Evaluating Imported Responses
When you already have model outputs — from a production system, another tool, or a previous run — you can evaluate them directly without regenerating anything. Pick the Evaluate Imported Responses type and follow its three-step flow:
- Choose a collection - Only collections with at least one text column are shown.
- Choose a response column - The text column that holds the outputs you want to evaluate.
- Choose evaluation criteria - The criterion set applied to those responses.
elluminate runs your criteria directly against the stored responses — no prompt template, model, or LLM inference is involved. This makes it ideal for benchmarking external systems or scoring responses collected elsewhere.
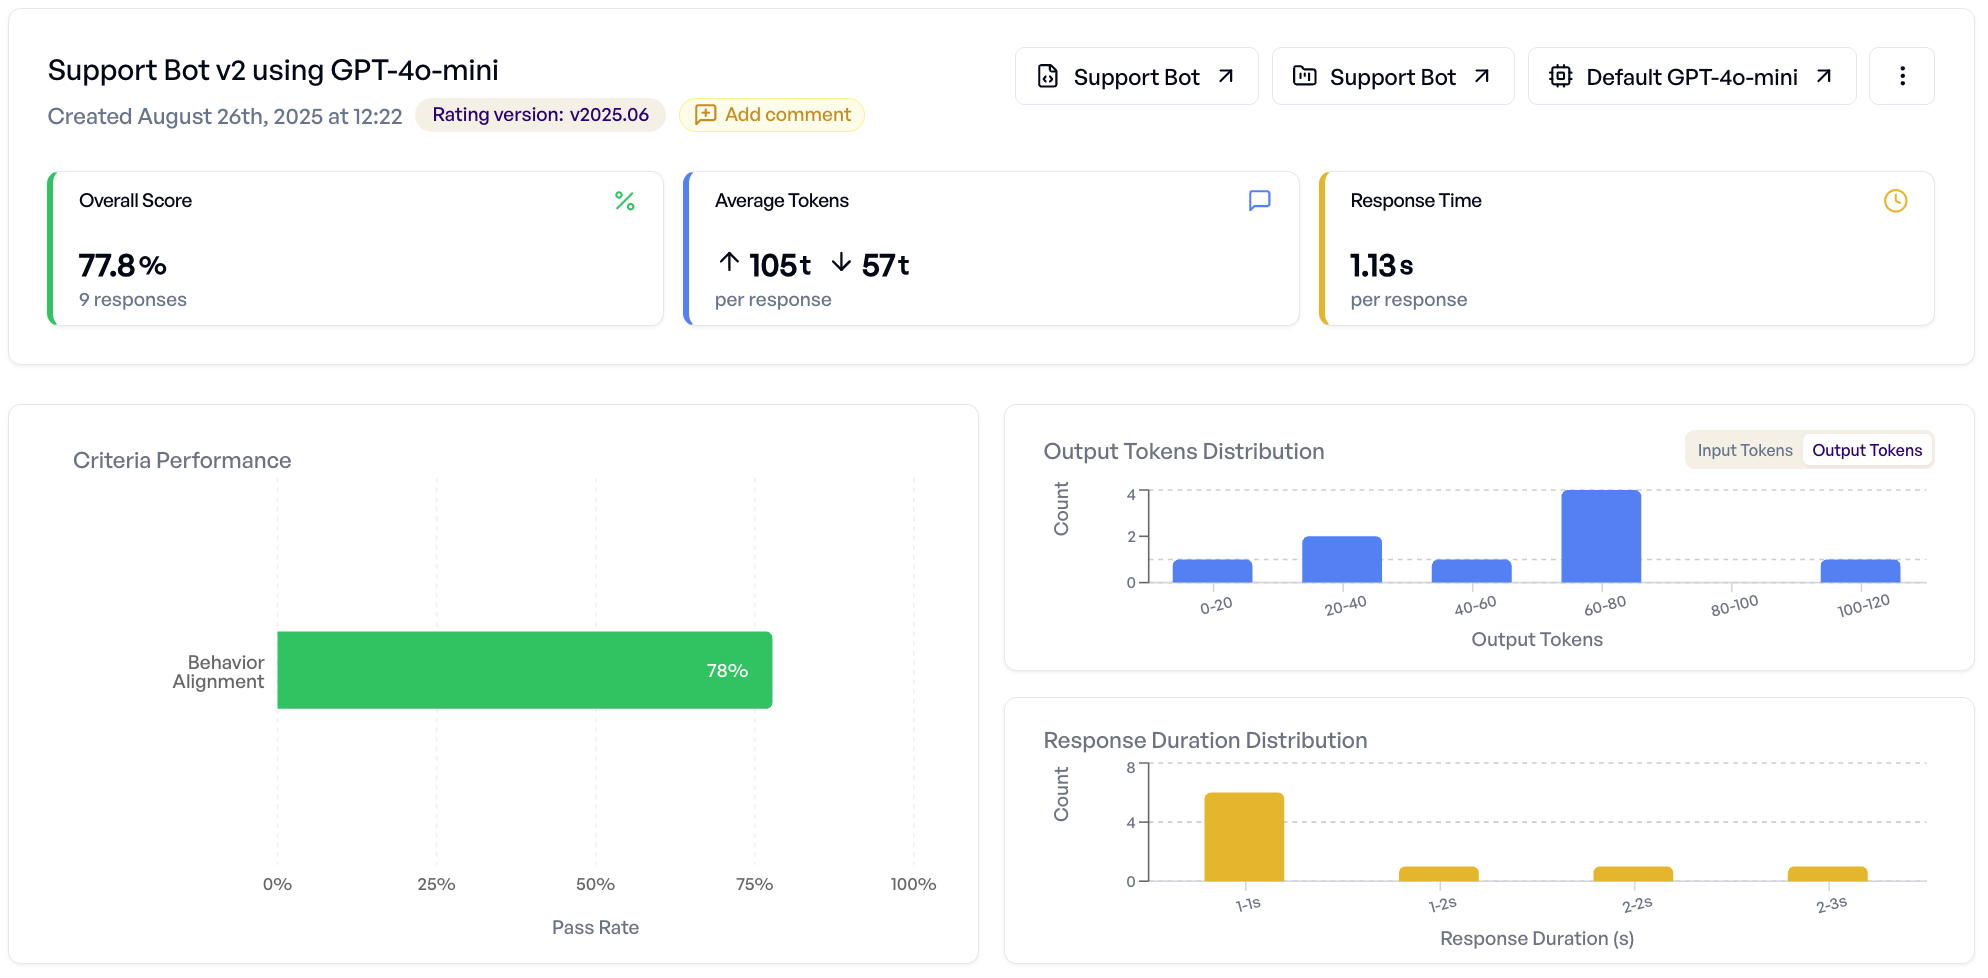
Understanding Experiment Results
Once your experiment completes, you can analyze results using two main views:
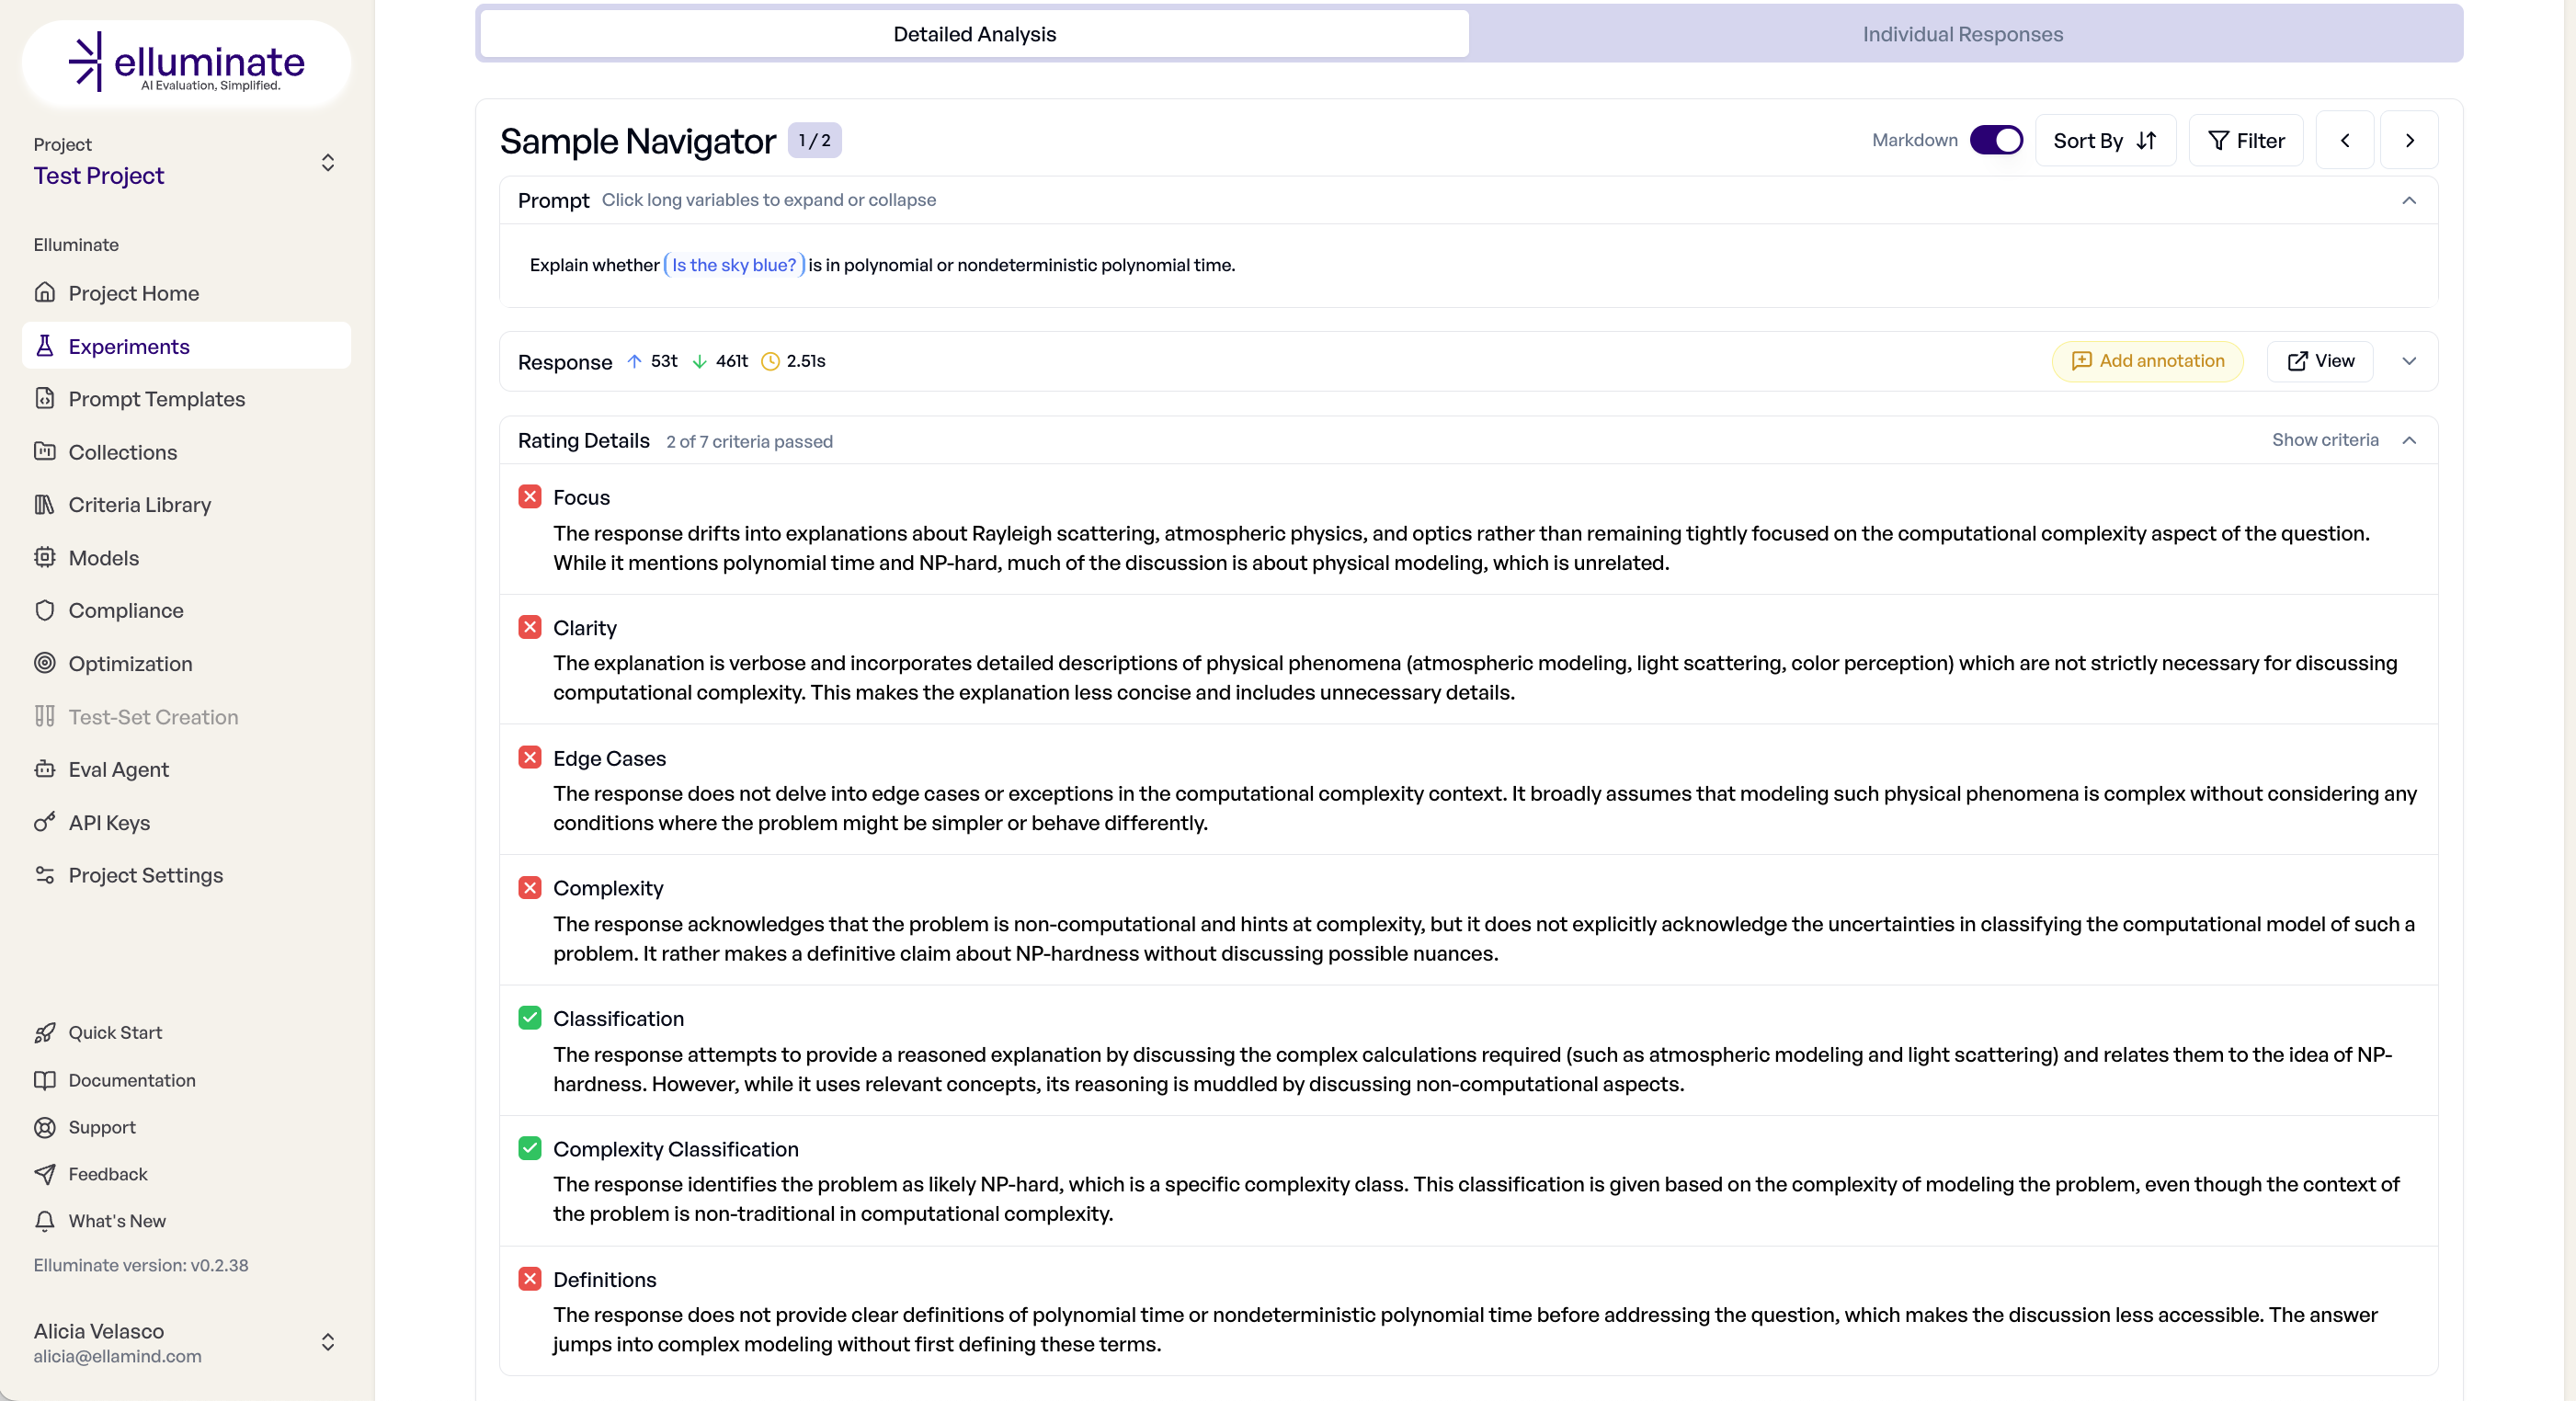
Detailed Analysis Tab
This tab provides aggregate insights and sample-by-sample inspection:
- Overall Performance - Success rates, score distributions, token usage
- Criterion Breakdown - Which criteria pass/fail most frequently
- Sample Navigator - Browse individual responses with full rating details
- Performance Charts - Visual analysis of score patterns and distributions
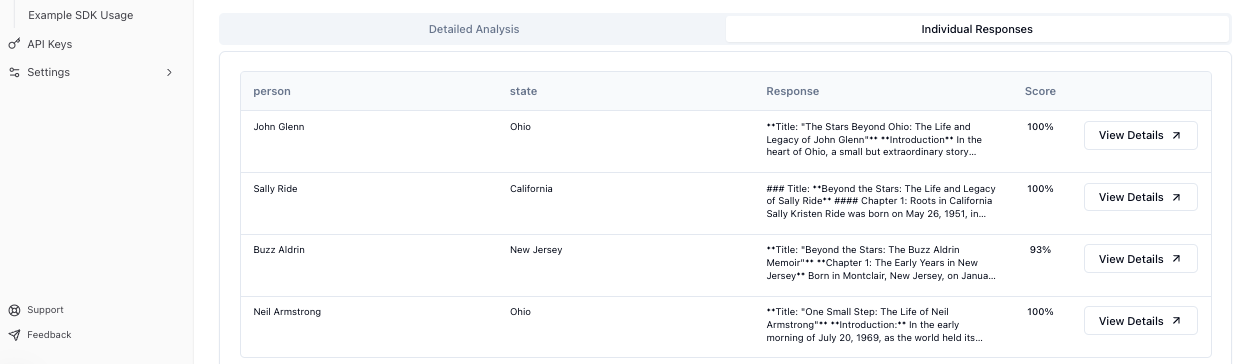
Individual Responses Tab
This tab offers a tabular view of all results:
- Response Table - Sortable list of all prompt-response pairs
- Rating Details - Pass/fail status for each criterion per response
- Export Options - Download results as CSV with full data
- Filtering - Focus on specific score ranges or criterion results
For detailed analysis techniques, see the Response Analysis Guide.
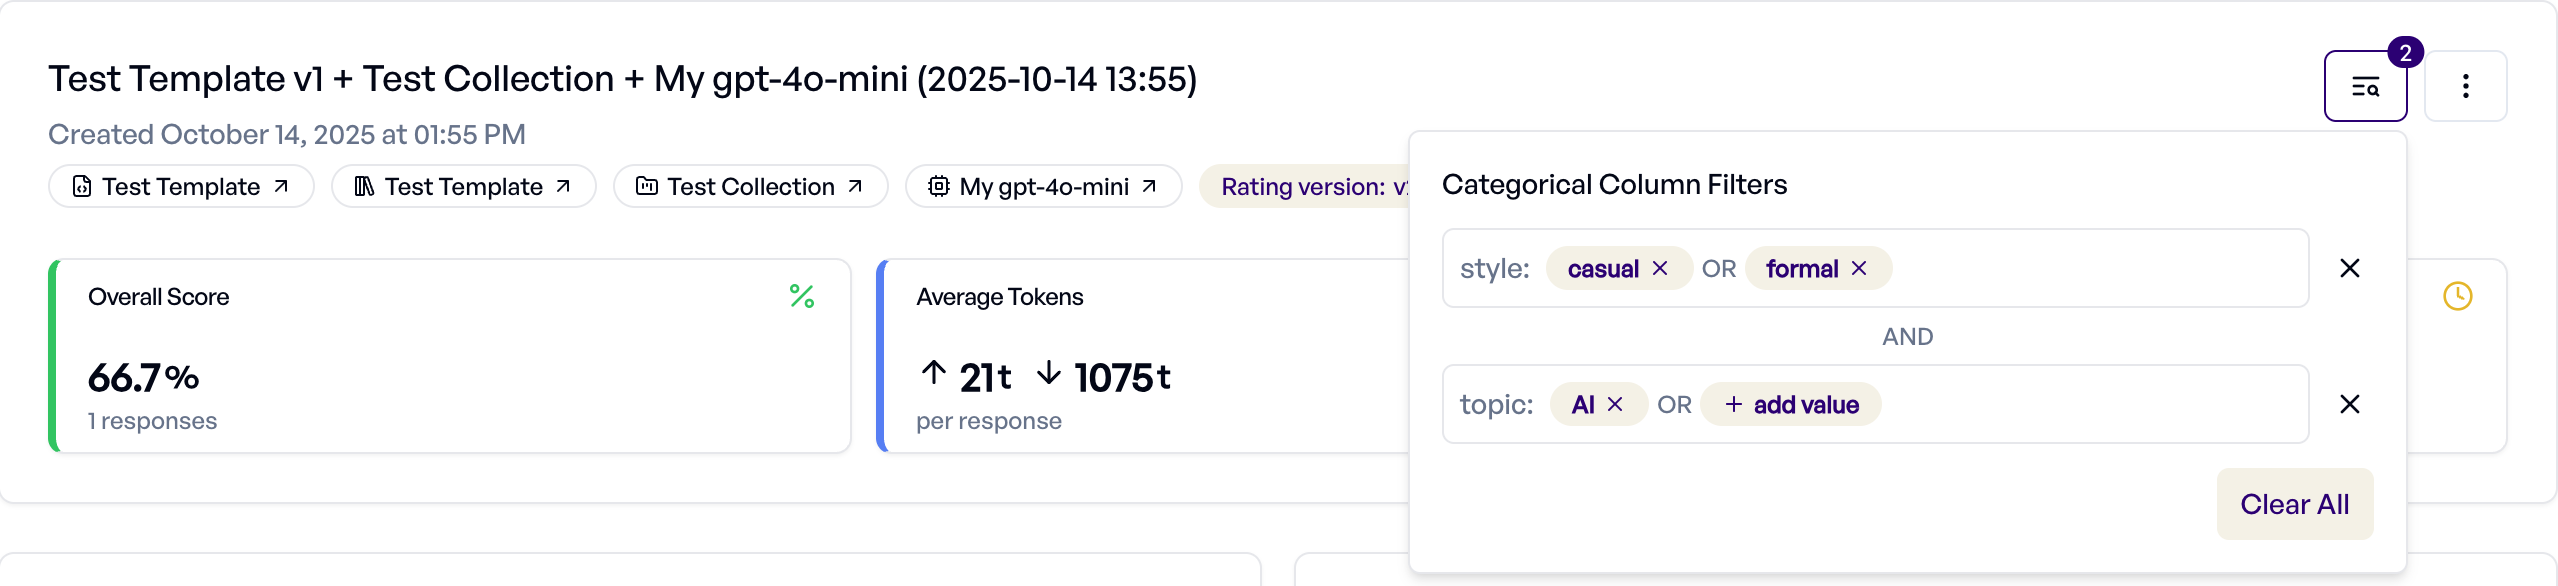
Filtering by Categorical Columns
When your collection includes categorical columns, you can filter experiment responses to analyze performance across different input categories.
Setup: Configure columns as Category type in your collection. See Column Types for details.
Usage:
- Click the filter icon in the experiment header
- Select categorical columns and values to include
- Multiple values within a column use OR logic (show responses matching any value)
- Multiple columns use AND logic (show responses matching all conditions)
- Metrics and charts update to reflect only filtered responses
This enables targeted analysis - for example, filtering by user_type being Enterprise or SMB to compare performance across customer segments, or region being US or EU to analyze regional effectiveness.
Comparing Experiments
elluminate supports comparing experiments to identify improvements and track performance changes.
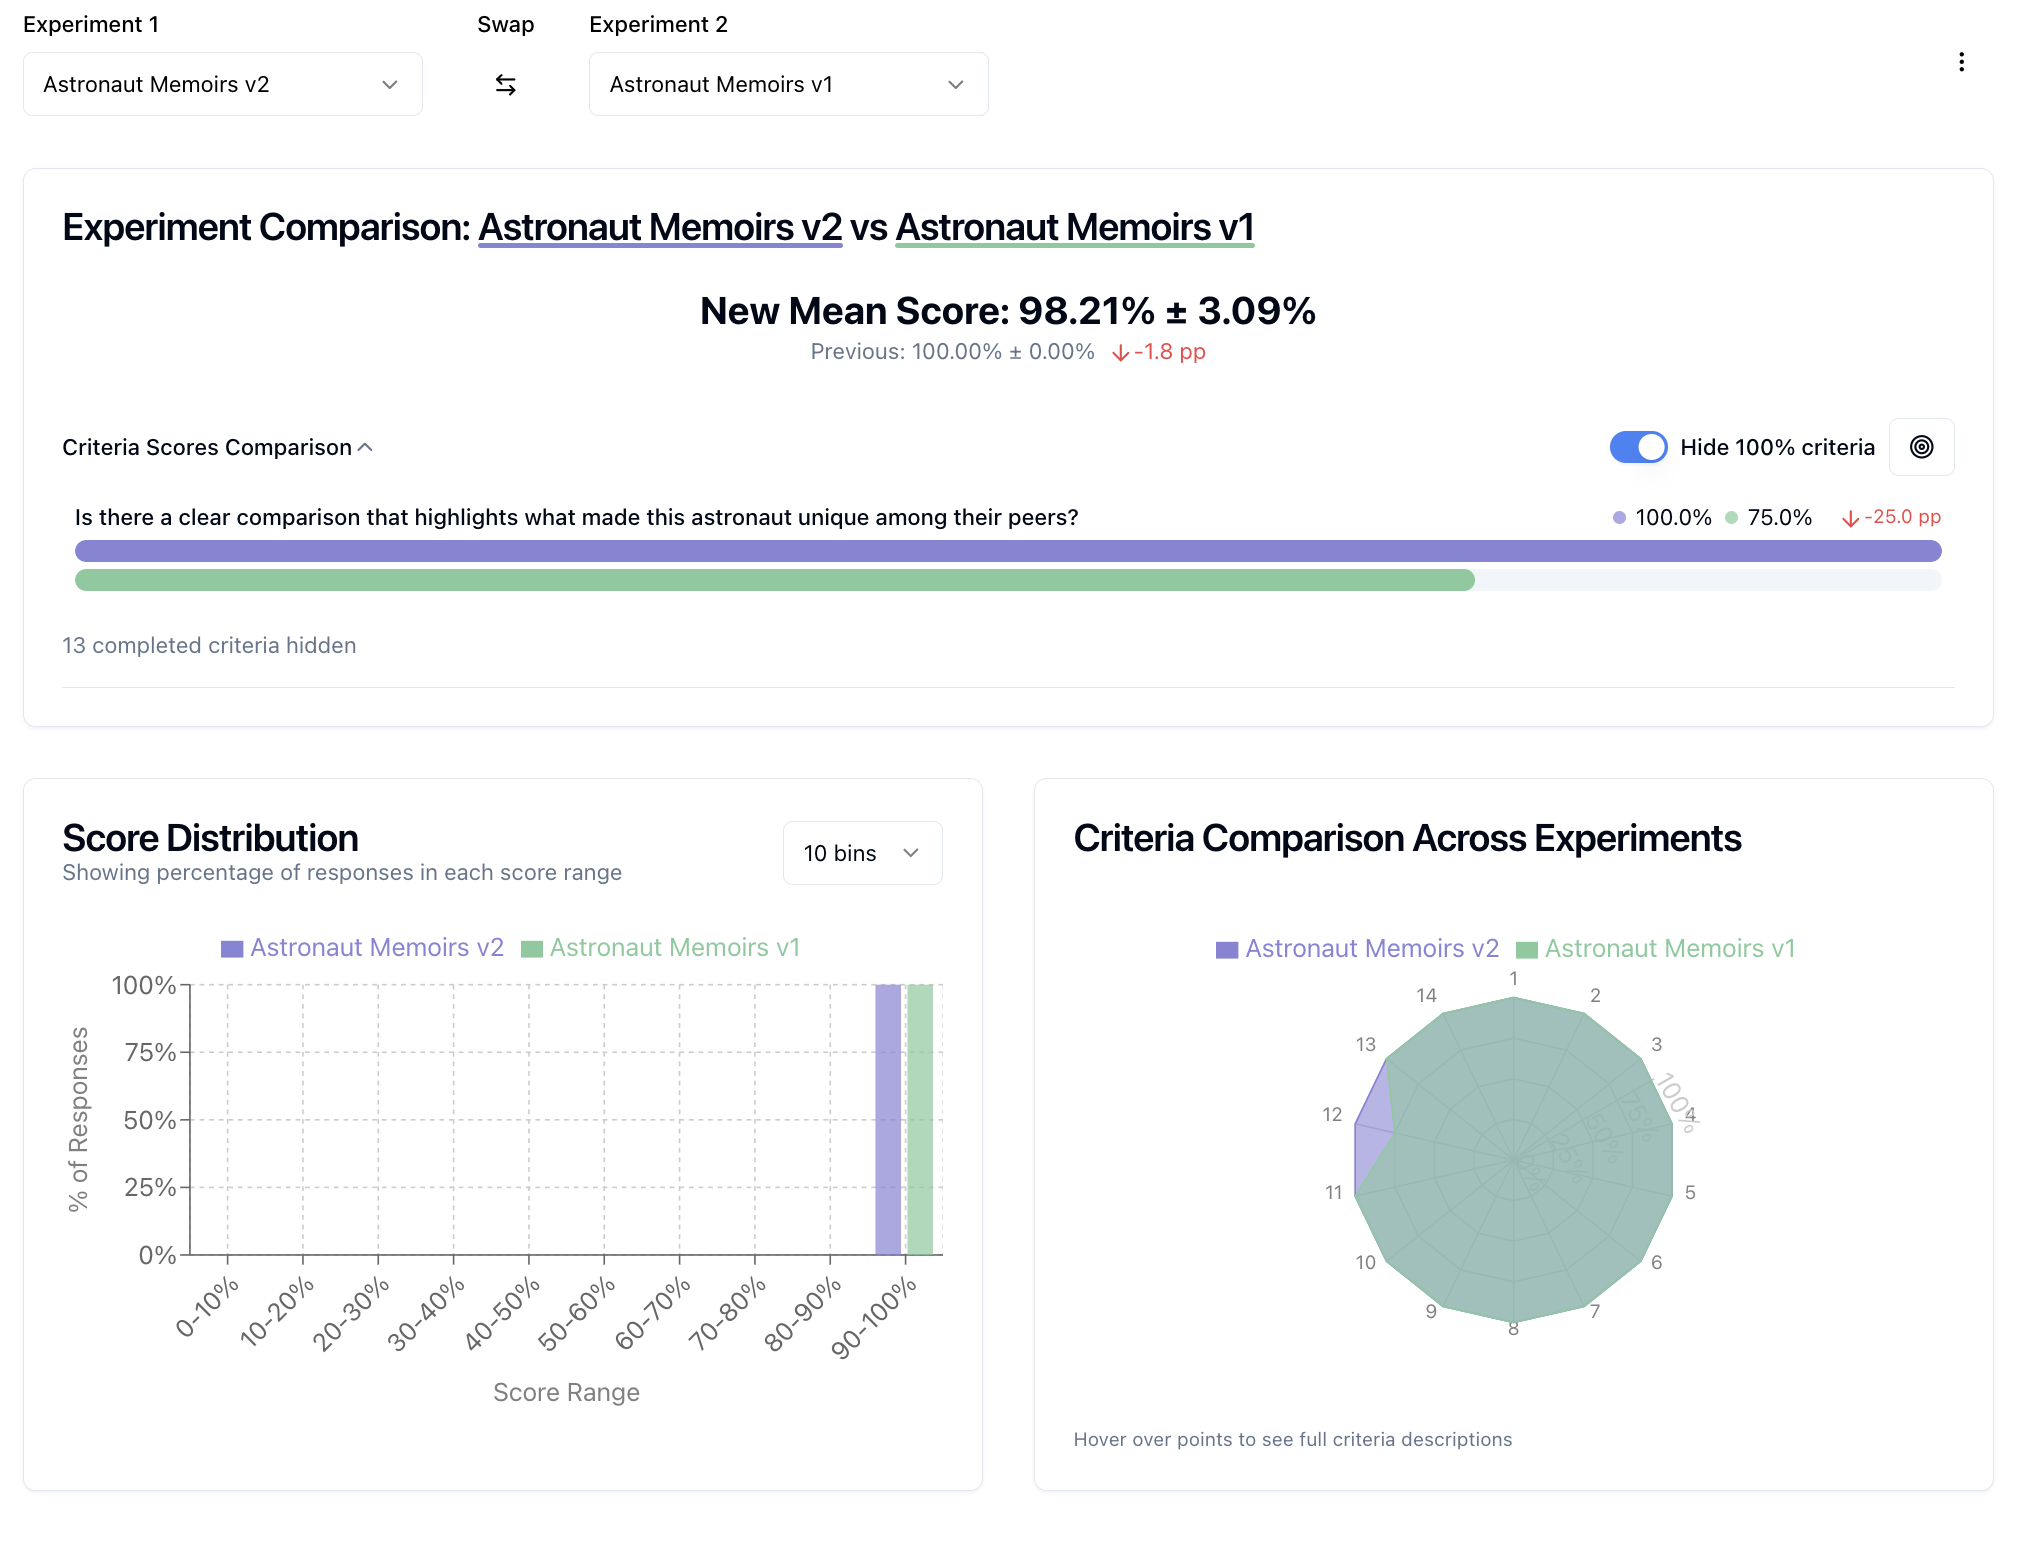
Two-Experiment Comparison
Compare two experiments side-by-side to understand differences:
- Select two experiments from your list
- Click "Compare" to access detailed comparison view
- Analyze side-by-side responses, criterion performance deltas, and overall score changes
Multi-Experiment Comparison
For high-level comparison across multiple experiments:
- Select 3+ experiments from your list
- Use multi-comparison view for aggregate performance trends
- Identify which experiments perform best across different criteria
Monitoring Performance Over Time
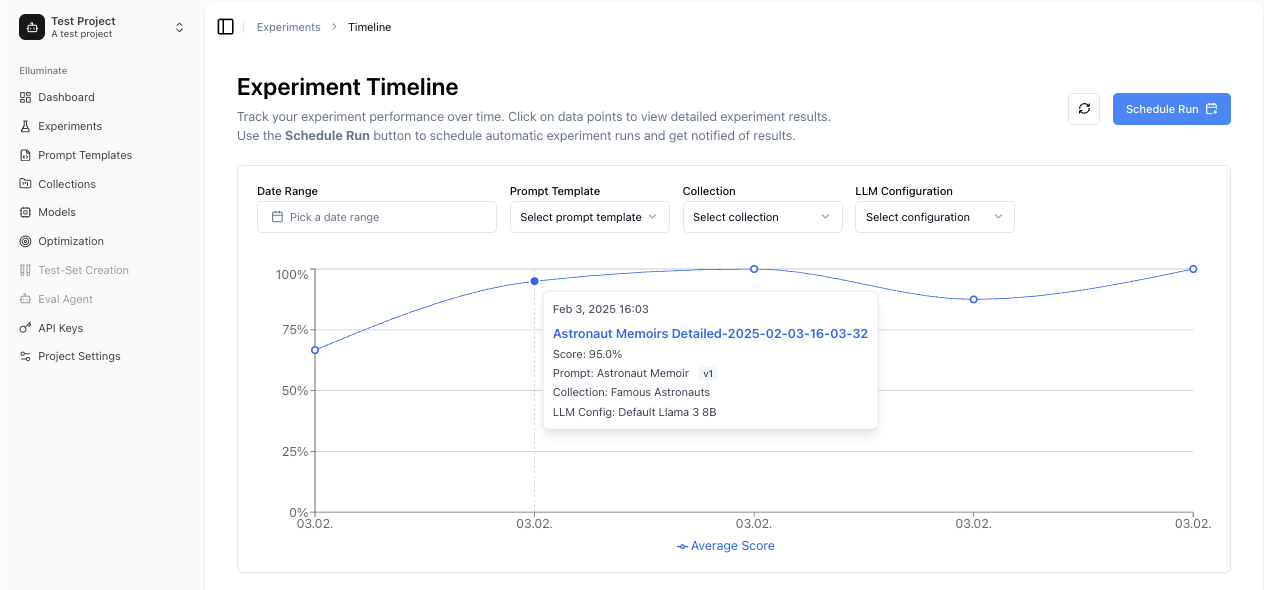
Timeline View
The Timeline provides historical performance tracking:
- Performance Trends - See how your experiments perform over time
- Filtering Options - Filter by date range, prompt template, collection, or model
- Data Point Details - Hover for experiment information, click to view details
Scheduled Experiments
It is possible to automate regular evaluations with scheduled experiments.
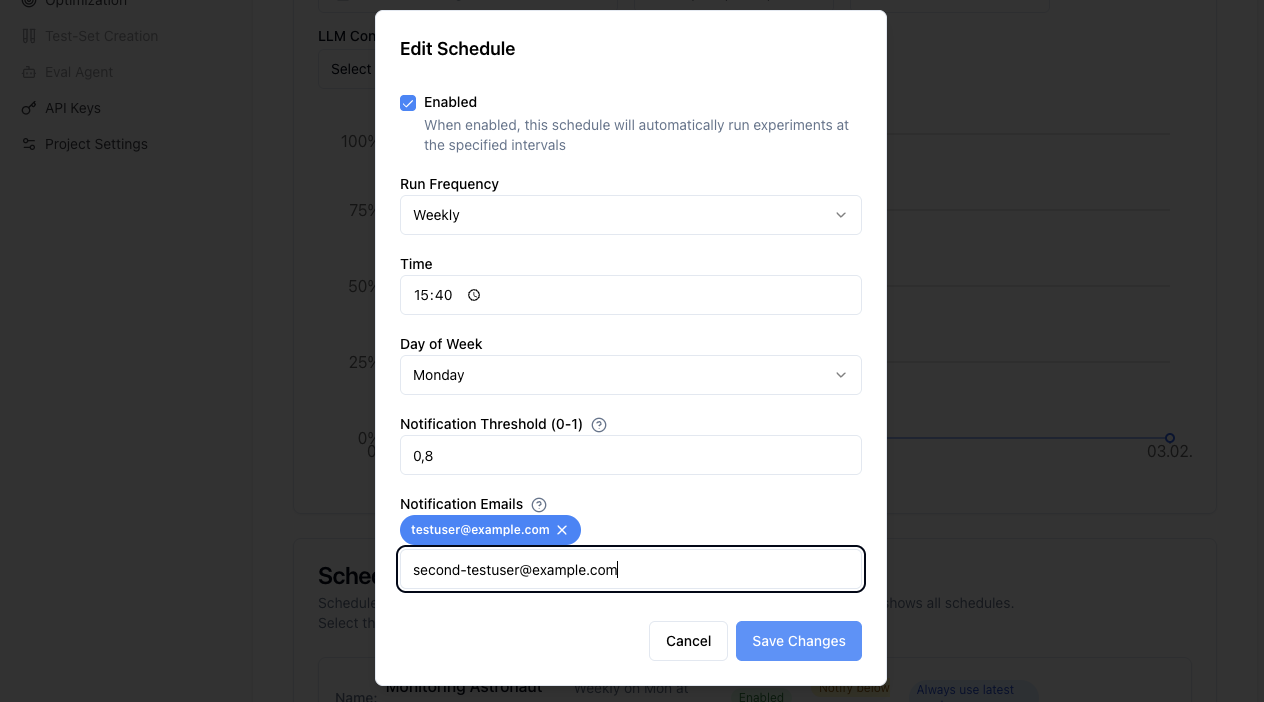
Creating Schedules:
- From Timeline view, click "Schedule Run"
- Configure frequency (daily, weekly, monthly)
- Set experiment parameters (template, collection, model)
- Configure notifications and thresholds
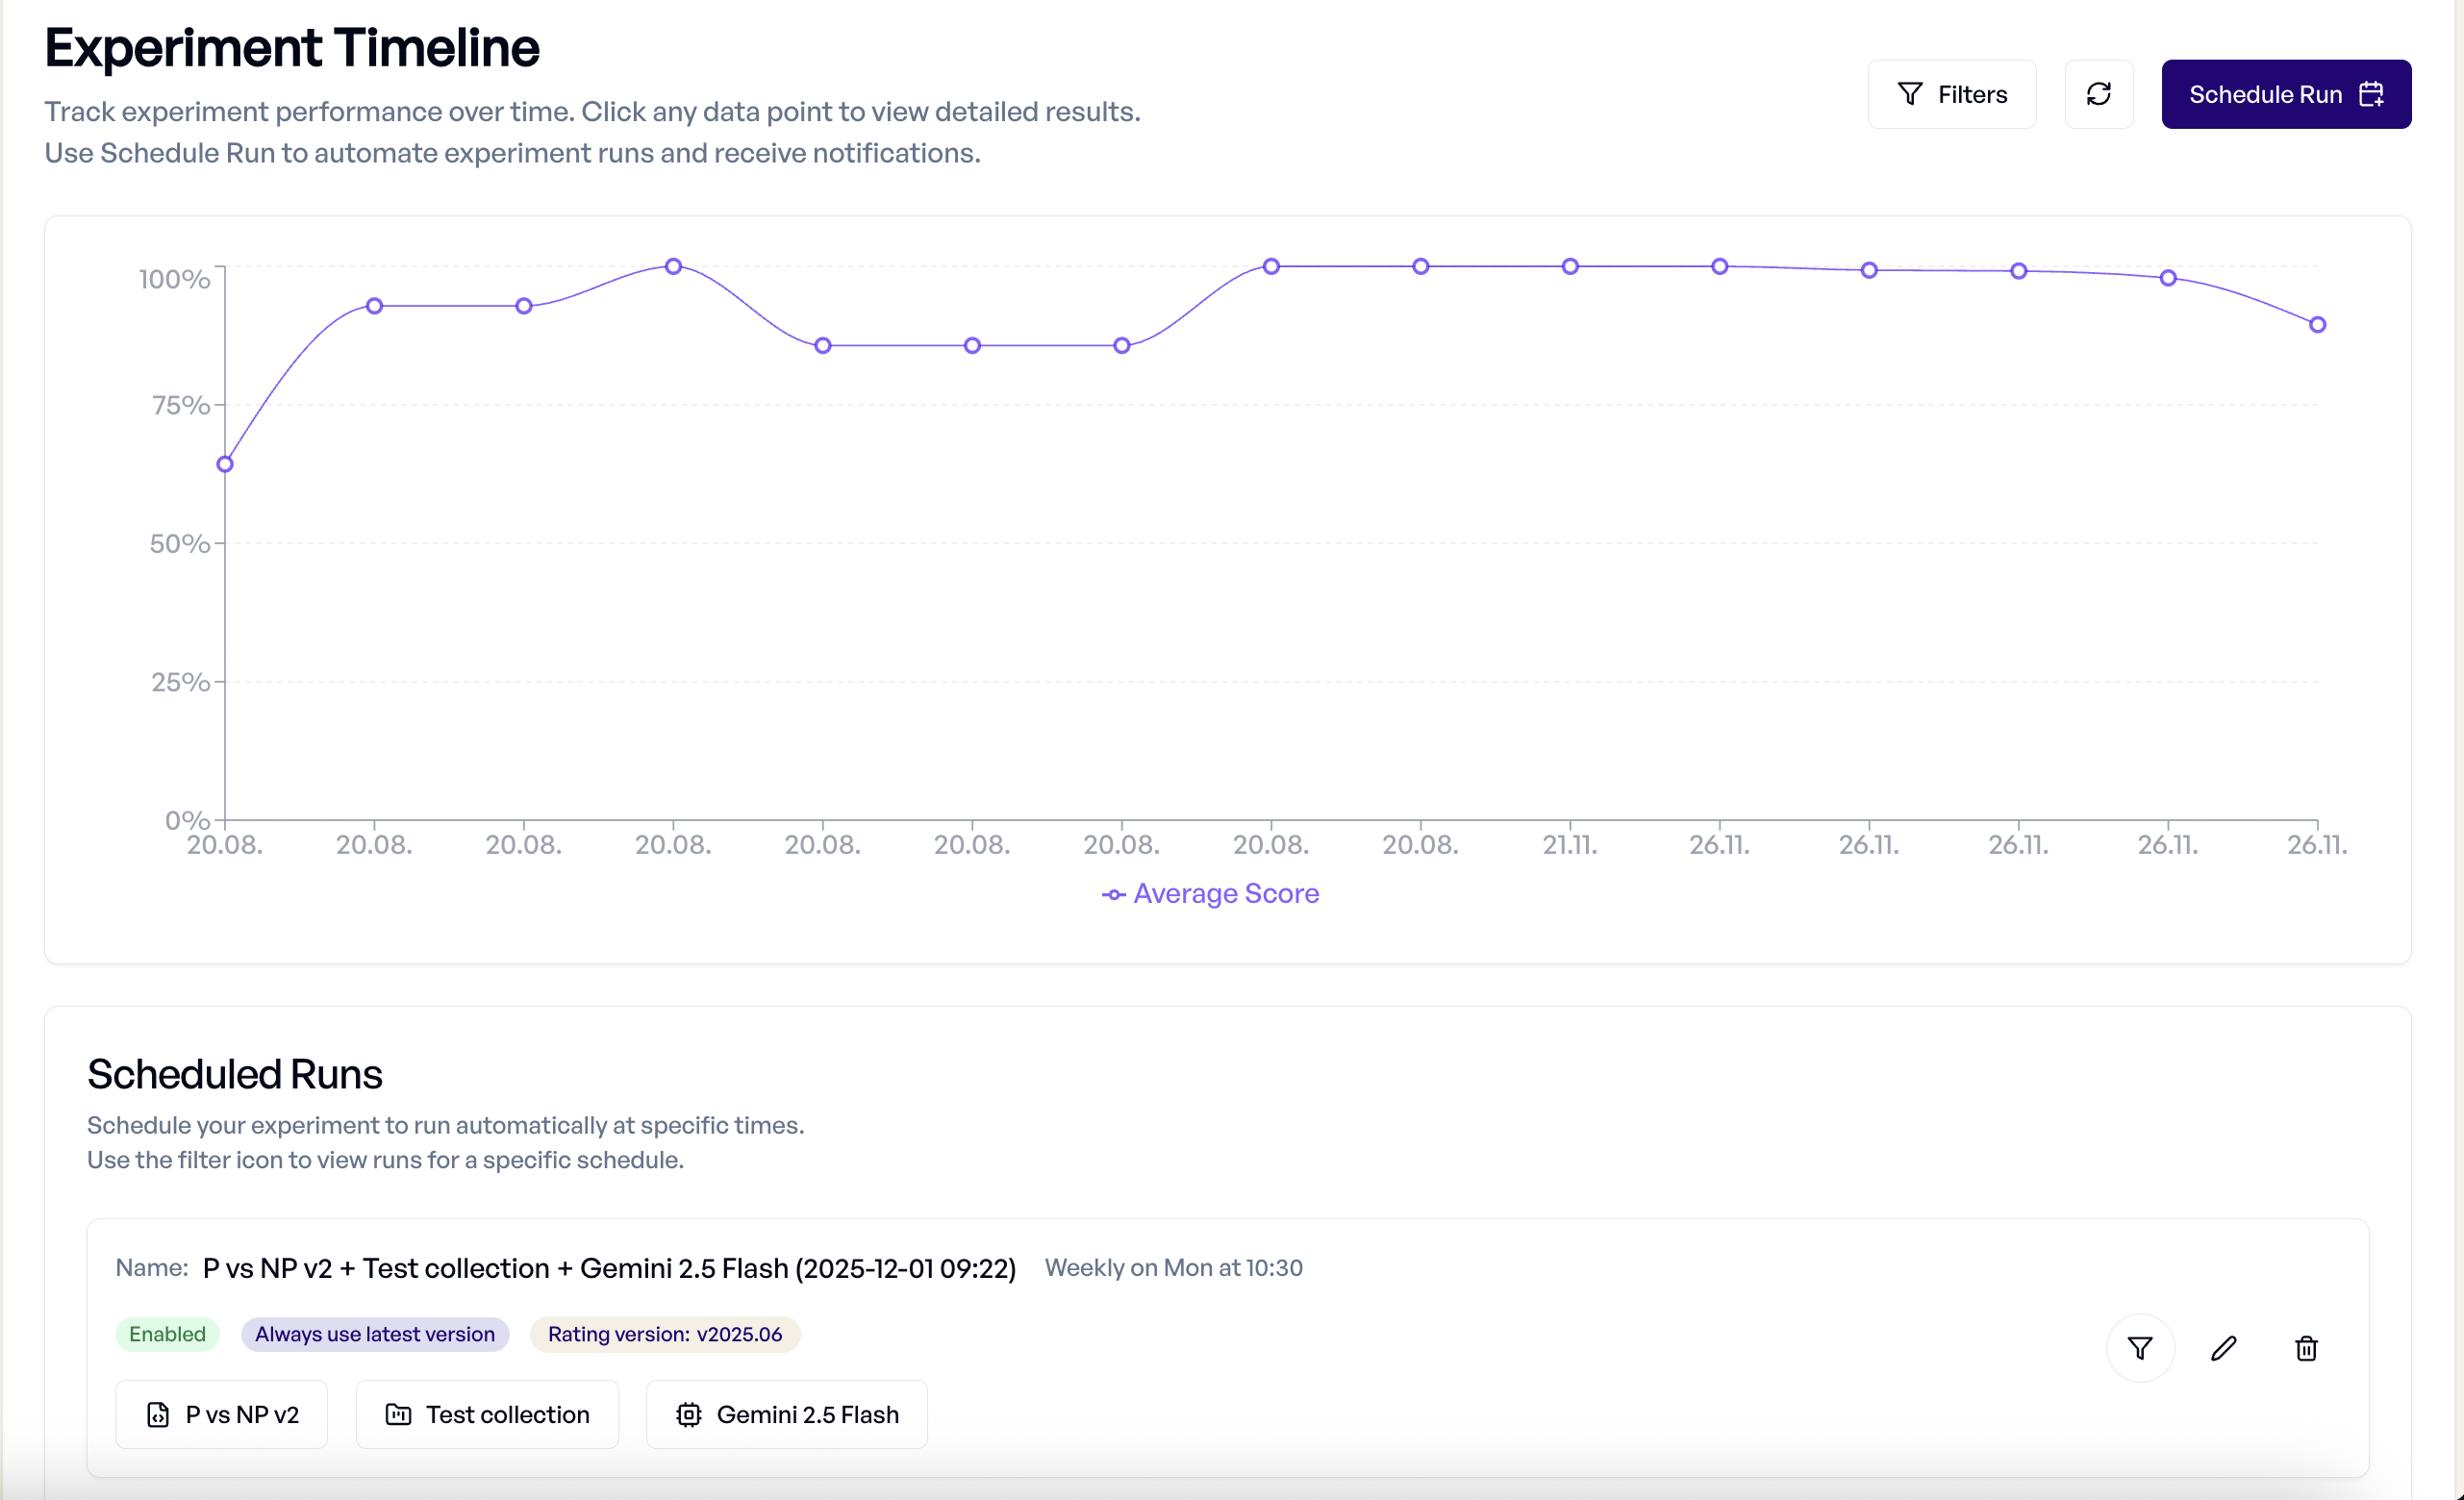
Schedule Management:
To manage your scheduled experiments, navigate to the Timeline view and scroll to the bottom. There you can:
- View All Schedules - Monitor active schedules and their settings using the filter function
- Edit Schedules - Modify frequency, thresholds, or disable schedules
- Delete Schedules - Remove scheduled experiments without affecting the previous runs
Advanced Features
Structured Outputs and Tool Calling
Experiments work seamlessly with advanced LLM features:
- Structured Outputs - Evaluate JSON responses with schema validation criteria
- Tool Calling - Rate tool usage and parameter correctness in agentic applications
- Multi-Step Workflows - Evaluate complex interaction patterns
For details, see Structured Outputs and Tool Calling.
Integration with Other Components
Experiments leverage your entire elluminate setup:
- Collections - Reuse test datasets across different experiments
- Prompt Templates - Version control ensures experiment reproducibility
- Criterion Sets - Apply consistent evaluation standards
- LLM Configs - Test different models and parameters systematically
Best Practices
Experiment Design
- Clear Objectives - Define what you're testing before running experiments
- Representative Data - Ensure your collection covers real-world scenarios
- Appropriate Criteria - Choose evaluation criteria that match your use case
- Controlled Variables - Change one thing at a time for clear insights
Performance Optimization
- Batch Testing - Run multiple variations together for faster iteration
- Strategic Sampling - Use smaller collections for rapid prototyping
- Cost Management - Use Fast rating mode when detailed explanations aren't needed
- Historical Context - Compare against previous experiments to track improvement
Quality Assurance
- Manual Review - Spot-check automated ratings for accuracy
- Edge Case Testing - Include challenging scenarios in your collections
- Consistent Evaluation - Use the same criterion sets for comparable results
- Documentation - Record experiment goals and findings in descriptions
SDK Integration
For programmatic experiment creation and management, you can use the elluminate SDK:
from elluminate import Client
from elluminate.schemas import RatingMode

client = Client()  # Uses ELLUMINATE_API_KEY env var
For complete SDK documentation, see the API Reference.
Troubleshooting
Common Issues
- Generation Failures - Check LLM config settings and rate limits
- Rating Errors - Verify criterion set compatibility with response format
- Performance Issues - Consider using Fast rating mode for large collections
- Missing Results - Ensure experiment completed successfully before analysis
Getting Help
When experiments don't behave as expected:
- Check Logs - Review experiment logs for specific error messages
- Validate Components - Test prompt templates and collections independently
- Review Settings - Confirm LLM config parameters are appropriate
- Contact Support - Reach out with experiment IDs for detailed assistance